How I Use scale_fill_gradient in R: A Guide with Examples
Learn how to use scale_fill_gradient in R to create stunning color gradients for your plots. Step-by-step tutorial with practical examples and tips.
3 min readNov 27, 2023

Read the complete article and download the code:
- How I Use scale_fill_gradient in R: A Guide with Examples
- Join our Community and Stay Ahead of Data Analysis Community
- Seeking Professional Coding Assistance? Elevate Your Projects with Our Expertise!
Key Points
- Scale_fill_gradient function allows us to create a continuous color gradient based on a numeric variable for our graphs.
- We can use the scale_fill_gradient function with the ggplot2 package, a powerful and popular R data visualization tool.
- We can customize the color gradient by changing the low and high colors, limits, breaks, and scale labels.
- We can apply the color gradient to different types of plots, such as bars, points, lines, and polygons, to enhance the visual appeal and the information of the data.
- We can also use other functions, such as scale_fill_gradient2 and scale_fill_gradientn, to create diverging or multiple color gradients for your plots.
ggplot2 Customization:
- How to Use scale_fill_gradient2 in R for Color Gradients
- How to Import and Install Packages in R: A Comprehensive Guide
- How do I customize my ggplot2 graphs?
- How to Use ggplot Shapes in R to Create Stunning Scatter Plots
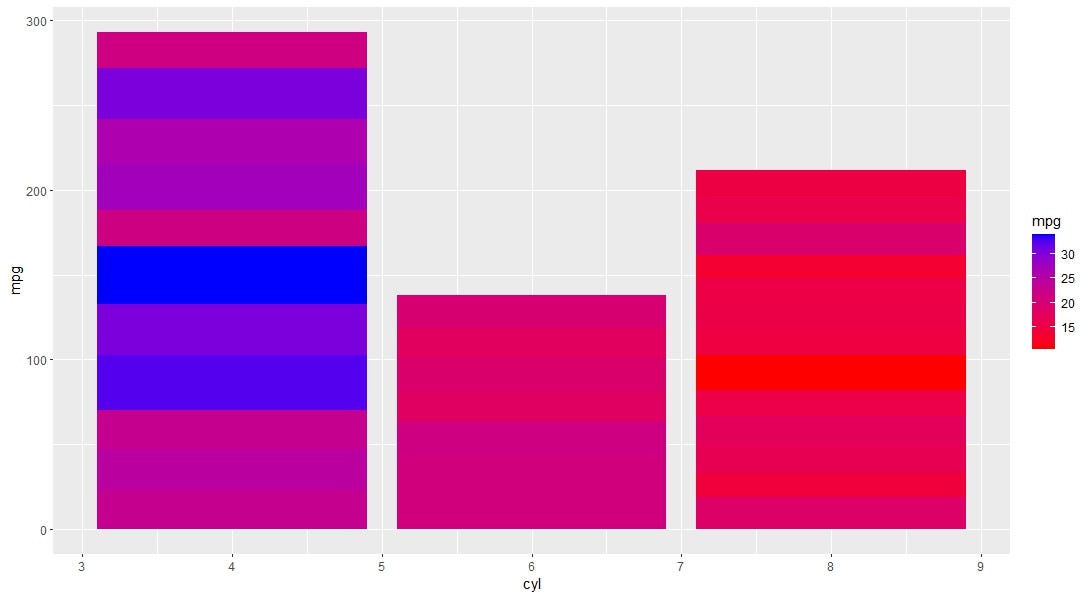
Create a bar chart with mpg as fill.

Before We Start, Make sure you have Read these Articles:
- Comprehensive Guide: How to install RStudio
- How to Import and Install Packages in R: A Comprehensive Guide
- No interest in Coding? Try our Shiny Apps
Add scale_fill_gradient with low = “red” and high = “blue”
Change the color gradient from red to blue to green to Brown

Change the color space from Lab to rgb

Create a new dataset with some missing values

Change the type of legend from colourbar to legend

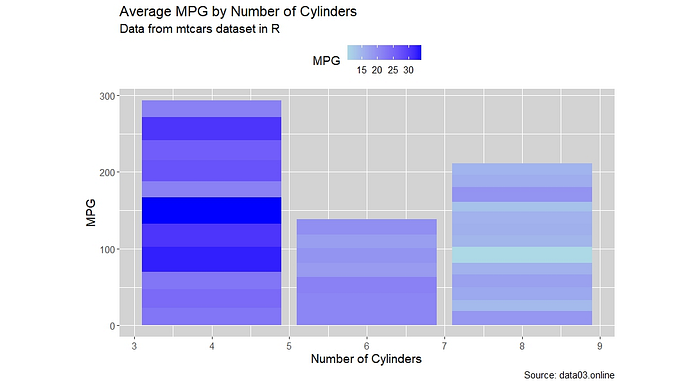
Add titles and labels with labs

Adjust the size and shape with theme
Create three plots with scale_fill_gradient

- Please find us on Social Media and help us grow:
- Facebook: https://www.facebook.com/DataAnalysis03
- Instagram: https://www.instagram.com/dataanalysis03/
- Twitter: https://www.twitter.com/Zubair01469079/
- Youtube: https://www.youtube.com/@data.03?sub-confirmation=1
- Tiktok: https://www.tiktok.com/@dataanalysis03
- Whatsapp Community: https://chat.whatsapp.com/IGjjvZVsGCiLn5jSmrFQaJ
- Whatsapp Channel: https://whatsapp.com/channel/0029VaBzfy80G0XbCXhGGA16 Telegram Channel: https://t.me/dataanalysis03
- Medium: https://data03.medium.com/
- Quora: https://www.quora.com/profile/Muhammad-Zubair-Ishaq
- Google News: https://news.google.com/publications/CAAqBwgKMIaV0QswxbDoAw?hl=en-PK&gl=PK&ceid=PK%3Aen